Don’t know when to enter/exit trades? Check out Market Timing Secrets
Forex trading basics
Forex practice videos
Offline Forex Simulator is a software tool that fully imitates the markets on demand – whenever you want it. Even without an Internet connection.
Offline Simulator is a handy tool for most of us with a day job who just don’t have enough time to spend watching Forex markets on weekdays.
How does the Simulator work? Similar to a recorded video, in the Simulator you are watching a “playback” of saved market price data – tick by tick.
In this article, we’ll show you, step-by-step, how you can test your trading strategy with the help of our Offline Forex Simulator.
We’ll try to give as detailed explanations as possible wherever needed. So that if you just starting, the text would be easy to understand. But if you are already familiar with the basics, you can just skip these parts.
You may also want to download User’s Guide in PDF format.
Quick links:
Offline Forex Simulator Download and Installation
Preparing the market data
Forex trading basics
Placing Orders
Stop Loss and Take Profit
Trading strategy
Manipulating the data feed
Trade analysis
Offline Forex Simulator Settings
Offline Forex Simulator download and installation
Offline Forex Simulator software is free for our subscribers. If you haven’t done it yet, subscribe here now. Subscription is also free.
You’ll receive all needed instructions by email immediately after you subscribe. You’ll learn how to activate your free license once you install the software.
Read how to get your free Simulator license or watch a short video guide.
Preparing the market data
Click the Offline button on the toolbar and you will be taken to the Data tab. This is where you prepare the historical price information to test on.
Our Offline Forex Simulator provides 100% accurate market modeling quality. Which is only possible if tick-by-tick data is used. A tick is a price quote received by the market. Each tick is a combination of 3 numbers: bid price, ask price and time stamp.
The time stamp has an accuracy of up to 1 ms. Such high precision is by no means excessive.
There can be over ten ticks each second during fast market moves. Which often happen during some major events or news releases. However, ticks can also come as rarely as 1 in a minute, typically in slow Asian sessions.
On the Data tab, you can load historical prices as a .csv file. We use high-quality market data provided by trueFX.com. Tick-by-tick data for 15 main currency pairs is available there for free (requires a free registration).
The Simulator also provides an inbuilt data file for you to quickly try out the software. In our example, we will be using this sample file, which contains 2 days worth of ticks. This is more than enough to get you started.
Click the Load sample data button. The loaded data interval will be shown on a calendar. The calendar is for one month, but this doesn’t mean that only 1 month long files are supported. The calendar just shows the 1st month of the data for you to select the start date and time for testing.
You have the options to specify the exact time or select one of the standard times, corresponding to the start of 3 major trading sessions (USA, Europe, and Asia).
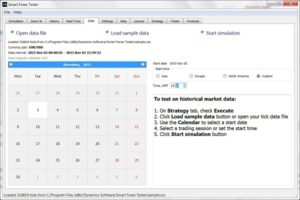
Let’s select the time of the most intensive trading. This usually happens when the US and European trading sessions start to overlap – at noon (GMT). Next, let’s begin a new simulation with pressing the Start button.
The focus will now switch to the main tab – Simulation. There, the main (middle) graph shows the big picture of the market: M1 candles for the last 4 hours. If you want a longer time frame or different average, you can right-click on the graph and adjust both. You can also select lines instead of candles.
The bottom graph shows the RSI 14. You can select another indicator or change number of periods from the context menu available with a right-click.
Upper graphs show ticks – using different time intervals. Both bid and ask prices are plotted. The LHS graph gives the closest view, while the RHS shows last 4 minutes. These intervals are configurable on the Settings tab.
The LHS graph is located closer to the Buy and Sell buttons so that you could use the price pattern to decide when to trade.
Now, get yourself familiar with the graphs and also try changing the time frames. Monitor the markets for a while.
When you are ready, our next step would be placing an order. But before, let’s have a short overview of the Forex trading.
Forex trading basics
What is traded in Forex is the ratios of 2 currencies – so-called currency pairs. The most intensively traded pair is EURUSD. You don’t buy or sell individual currencies, like euros or dollars. You bet on the direction of their exchange rate.
What you buy or sell is called a lot. The standard (full) lot is 100 000 dollars. There are also smaller lots – mini (10 000), micro (1 000) and nano (100).
To be able to trade, you need to deposit money with your broker. Good news, to buy a full lot you don’t need $100 K. This is possible because of leverage. Usual leverage is 100:1. Meaning that you only need to have $1,000 on your account to buy or sell a standard lot. Lot price will also depend on your account currency. Your broker will use your deposit to protect itself against possible losses from your trades.
How do you make money in Forex?
For example, if you bought the EURUSD, you will win if the Euro rises against the Dollar. Wise versa, if you sold the EURUSD pair, you will profit when the Dollar exchange rate vs the Euro is growing.
Say, you bought a standard EURUSD lot and some time later the exchange rate went up 0.5%. While this doesn’t sound like too much, because of the leverage, your profit on the standard lot would be $500.
Good news, you haven’t actually had to spend any money yet (assuming your broker doesn’t charge you a commission for your trades).
Bad news, your risk is defined by the leverage as well. If the Euro fell 0.5% vs the Dollar, your loss would be the same $500.
Then again, as long as you keep your position open, these losses would not materialize. So, if you are lucky and the Euro regains losses, you might be winning again.
However, if the price drop continues until your paper loss becomes comparable with your deposit, the so-called margin call will occur. In this case, your broker will close your position to protect itself against further losses. And it will take all your deposited money.
Note that if you had enough money to buy the whole lot, you wouldn’t need to use leverage. Without leverage, your risks are lower but so are profits. This kind of trade you can do if you e.g. convert money on your bank account from one currency to another.
Orders
Now, let’s get our hands dirty and try to enter the market. In other words, place an order. We can place BUY or SELL orders.
First, choose the order size in lots. There is a menu element for that. By default, the size is 1. Let’s leave it like that for now. Then, click an order button, e.g. Buy.
We can see immediately that a position was opened. This is called one-click trading. We opened a so-called market order. This means that we requested to buy or sell at the price that is available on the market the moment we place our order.
Let’s go into more details here.
In real trading, you use a trading terminal to place orders. The terminal is connected to the Forex market via trading servers. Technically, the order process is like this: when you click on the button in the terminal, it sends a command to the trading server. The server tries to place an order as requested and will respond with a ticket number if it succeeds.
Most of us connect to the trading servers over the public Internet. So – depending on the quality of your connection and location – the delay imposed can easily exceed 500 ms.
On the fast-moving market, this can be long enough time for the requested price to change. In this case, the server will return an order fill error.
Offline Forex Simulator contains both trading terminal and trading server in one machine, so the connection delay is virtually zero. But we added an option to the Simulator to introduce a configurable connection delay. This way, you can get a feel of what can happen in the real world.
Now when the order is placed, we opened a position. A BUY order opens a long position, while a SELL order is called a short position. Our position’s summary is visible in the small table below the order buttons. Full information you will find if you switch to the History tab.
You can see that immediately after the trade we are losing money. This is the most common scenario. The reason for that is the spread – the difference between sellers’ price (ask) and buyers’ price (bid).
The spread can be as low as 0.1 pips in a liquid market. However, at times of market uncertainty, spreads can exceed 10 pips.
We always have to buy at the asking price but sell at the bid price. So, if the prices stayed unchanged after our trade, our loss would always be equal to the spread.
Now we keep watching the market and wait for the good time to close our order and take some profit. You can close the order by clicking on the Close button.
For example, our BUY order will be closed at the bid price. So your profit in money would be (bid-ask)/ask * lot size.
Stop-loss and Take Profit
Next, let’s place another order and this time try to protect us against excess losses with a so-called stop-loss order.
Basically, this is a delayed order associated with the one that we just placed. It must be placed in the direction of unfavorable price movement. So, for a BUY order, stop needs to be below current market price, and for a SELL order – above it.
Exactly the same logic applies to take profit orders, but in the opposite direction. When the price reaches the desired level, your order will be closed with profit.
It is very common that Forex brokers restrict how close to current market price levels you can place stops or take profit orders. This is called distance to market.
Obviously, brokers are trying to reduce the unnecessary load on the server if the stops are set too close and triggered very often.
Our Simulator provides a configurable parameter to mimic this behavior.
So, now we have a working order and we will use buttons to place both stop loss and take profit orders.
When you click on the button, a dialog window will open. By default, the Simulator will automatically put the price that is as close to the market, as is allowed.
There will be a horizontal line indicating this price level. You can adjust the price either by typing the value into the box or use the up/down button to set it graphically. Clicking OK will complete the process.
You can always move both stops and take profit orders.
For example, if you see that the market moved in your favor, you can move the stop-loss order closer to your market entry level and thus minimize your potential losses, should the market reverse the direction. Or move you take profit further from current levels, to aim for a bigger profit.
However, you need to remember that every time the distance to the current market price will be enforced.
Trading strategy
So now we have all the orders in place. What next?
We need to follow the markets closely and look for the good moment to close our position with a profit. And avoid losses.
It may look that after you protected your position with a stop loss and added a take profit goal to your order, you can just relax and wait.
Unfortunately, even though passive waiting might work well at times, it is rarely effective. See-sawing is a normal state of the market, and quite often it is very violent.
So it may happen so that your target level is reached, but prior to that market quickly dips and triggers the stop-loss. If you are monitoring the situation, you could move the stop-loss order further from the market and avoid its triggering. But what if the market would continue dipping?
Here we are actually coming to the trickiest part of the Forex trading – you need to have a clear vision of what you are expecting. In other words, what exactly you are going to do – given a particular market’s behavior.
This is called a Trading Strategy.
It doesn’t mean you need to know what will happen. This is obviously impossible. You might try to guess the most probable outcome. But you have to know beforehand what you will do in each scenario. And follow your plan without exceptions.
It’s very tempting to change your mind when you are watching live markets. You may think that “… just a little bit more, and it will turn to where I am looking for..”
We could talk about the strategies for very long, but we will stop here. We leave you on your own in the markets. Play it for some time. Having gained some first-hand experience, you will understand much better what we meant.
Manipulating the data feed
One thing you will definitely notice is that watching markets can be at times both boring and very time-consuming. If you were using a regular demo account in real-time, there is nothing you could do about it. But not with offline Forex Simulator.
By default, the Simulator renders the ticks from the loaded file strictly according to their original timestamps. But you can change that.
To save your time, the Simulator enables Fast Forwarding the data feed. There are buttons to increase the speed to 2X, 4X and even more.
For example, if you are watching slow Asian market, where new ticks might come as rarely as once a minute, you can easily increase the speed twice or even more – and still be able to adequately react to the new ticks and make trading decisions. And if the situation changes – you can always return to the normal speed.
Moreover, if the market becomes too fast-paced, you can also reduce the data speed! In the Slow Motion mode, you can watch and study the violent moves and even react to them and try to get a feeling of how to trade in such an environment. There are buttons to reduce the speed to 1/2X and 1/4X.
Trade analysis
If you want to review your trades, you will find all the needed information in the table on the History tab. The table is self-explanatory. You can check the date and type of your orders and their profits. One thing to mention here is the cost in account currency.
One of the most important features of the Simulator is the Zoom In. You can select an area on the graph and see exactly what happened at any time – with a tick accuracy.
Offline Forex Simulator Settings
On the Settings tab, you can adjust many of the graphics parameters.
Also, you can select your account currency. Note that not all combinations of account currency and the currency pair work.
In addition, you can select the lot size.
We recommend consulting the Help tab for all available options.
Something unclear? Want more details?
Download User’s Guide in PDF format.